Statistics is the queen of all sciences! You can only make the right decision based on numbers. And the more accurate these numbers, the lower the probability of error. Unfortunately, the subject of auto parts is complex, heterogeneous and difficult to study due to the low level of automation and the lack of any accounting for small market players. But we still managed to get some data. We hope that they will be useful to you!
Trends
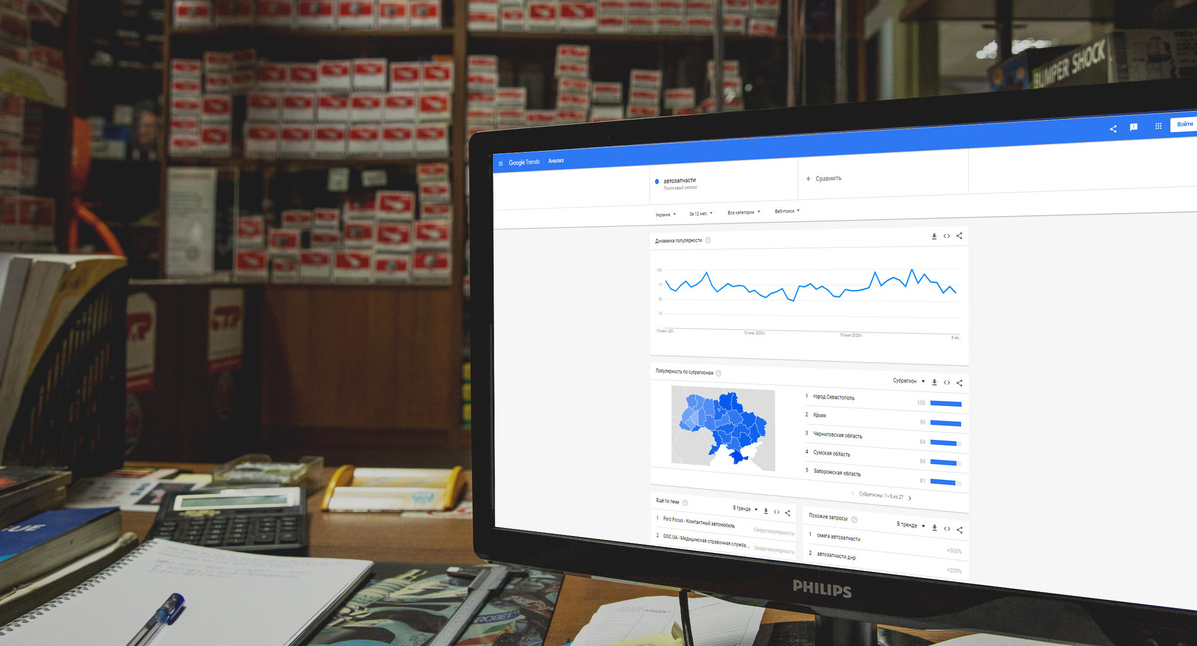
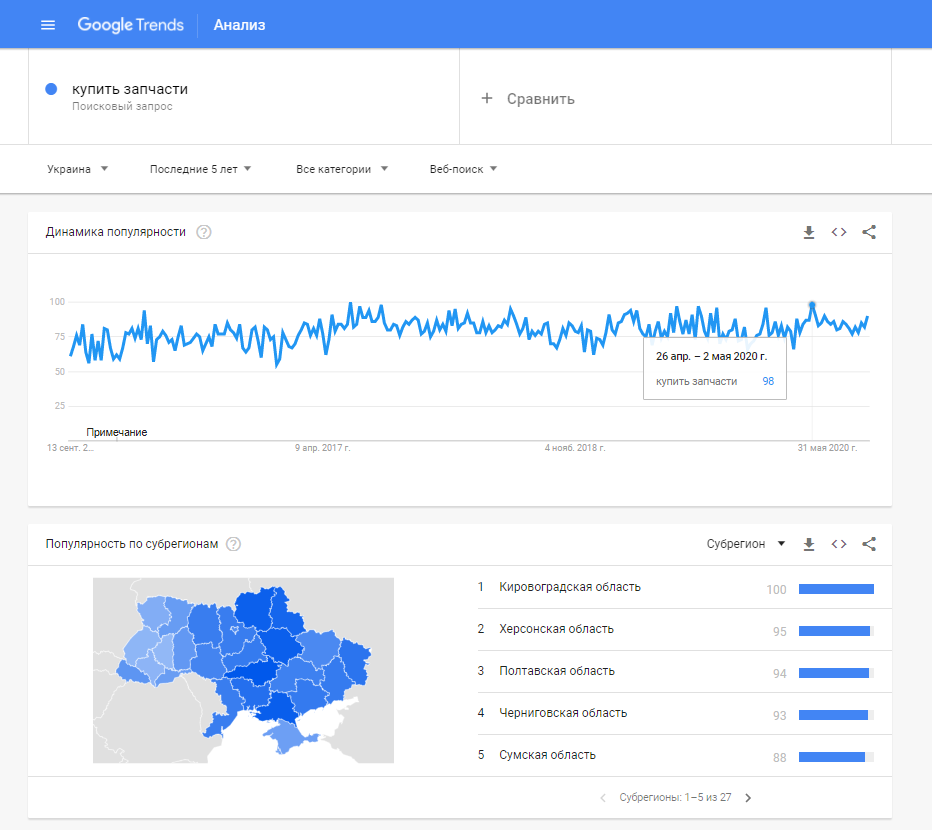
Users' interest in buying spare parts has only been growing over the years. The maximum value according to Google Trends was reached at the end of April 2020.
Calls and traffic
The guys from Ringostat created a dashboard with anonymized data on site visitors and calls from November 2019 to the present day. This data can be trusted because Ringostat is a popular tool for end-to-end analytics, call tracking and telephony, which is used by thousands of businesses.
Based on the figures obtained, along with furniture and electronics, auto parts, accessories, tires and wheels are among the growing topics.
It is noteworthy that the subject of auto parts during the quarantine period not only did not sink, but also showed growth, which is likely to accelerate with the onset of autumn. This is primarily due to the seasonality of the business.
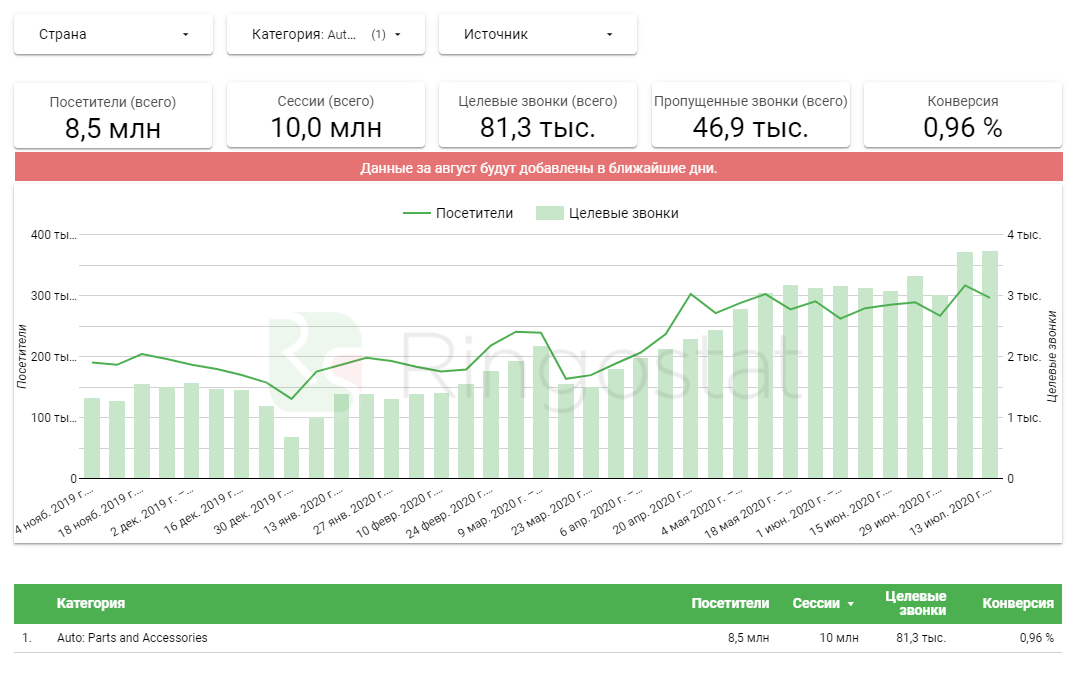
Data source: Ringostat
PPC Cost
Data obtained by analyzing 20+ active accounts of online auto parts stores between February and March 2020
- The cost of an average click in a topic - UAH 3.02
- Minimum cost - 0.07 kopecks
- Maximum cost - UAH 216.53
Average cost per click by product category, including queries like “category+brand+model”
|
Auto Parts Category |
Price, UAH |
|
Piston |
2.58 |
|
Throwout bearing |
2.66 |
|
Water pump |
2.67 |
|
Clutch master cylinder |
2.74 |
|
Hub bearing |
2.86 |
|
Lambda probe |
2.87 |
|
Brake pads |
2.9 |
|
Oil cooler |
2.96 |
|
Clutch disc |
3.02 |
|
Ball joint |
3.06 |
|
Clutch basket |
3.15 |
|
Shock absorbers |
3.16 |
|
Brake discs |
3.18 |
|
Stove radiator |
3.21 |
|
Clutch kit |
3.47 |
|
Suspension arm |
3.62 |
Average cost per click for car brands, including queries like “parts+make+model”
|
Car brand |
Price, UAH |
|
SUBARU |
1.86 |
|
CHRYSLER |
1.91 |
|
MAZDA |
1.92 |
|
PEUGEOT |
1.93 |
|
BMW |
1.94 |
|
CHEVROLET |
1.95 |
|
HONDA |
2.01 |
|
FIAT |
2.02 |
|
HYUNDAI |
2.03 |
|
MITSUBISHI |
2.03 |
|
VOLVO |
2.04 |
|
NISSAN |
2,05 |
|
TOYOTA |
2,11 |
|
OPEL |
2,13 |
|
KIA |
2,16 |
|
FORD |
2,18 |
|
LEXUS |
2,28 |
|
AUDI |
2,33 |
|
SUZUKI |
2,35 |
|
INFINITI |
2,36 |
|
SKODA |
2,49 |
|
CITROEN |
2,56 |
|
RENAULT |
2,59 |
|
MERCEDES |
2,74 |
|
VW |
2,89 |
Источник данных: Google Ads
Популярные бренды
Наиболее искомые бренды автозапчастей в 2019-2020 в порядке убывания для каждой категории
|
Категория |
Бренд |
|
Амортизаторы |
Kyb Sachs Monroe Bilstein Koni |
|
Поршень |
Kolbenschmidt Mahle Nural Autowelt |
|
Выжимной подшипник |
Sachs |
|
Подшипник ступицы |
Saf Snr Skf Bpw Fag Alko |
|
Лямбда-зонд |
Bosch Ngk |
|
Тормозные колодки |
Ferodo Remsa Hankook Frixa Bosch Mando Textar Lpr |
|
Диск сцепления |
Sachs Luk Exedy |
|
Шаровая опора |
Trw Lemforder |
|
Корзина сцепления |
Sachs Ferodo |
|
Тормозные диски |
Brembo Zimmermann Trw Ferodo Remsa Bosch Sangsin Blue Print Fenox |
|
Комплект сцепления |
Luk Sachs Krafttech Exedy Aisin Mecarm Wabco |
Объемы трафика
Максимальный фактический трафик интернет-магазина автозапчастей - 3,23 млн.
Расчетный потенциал - 5 млн
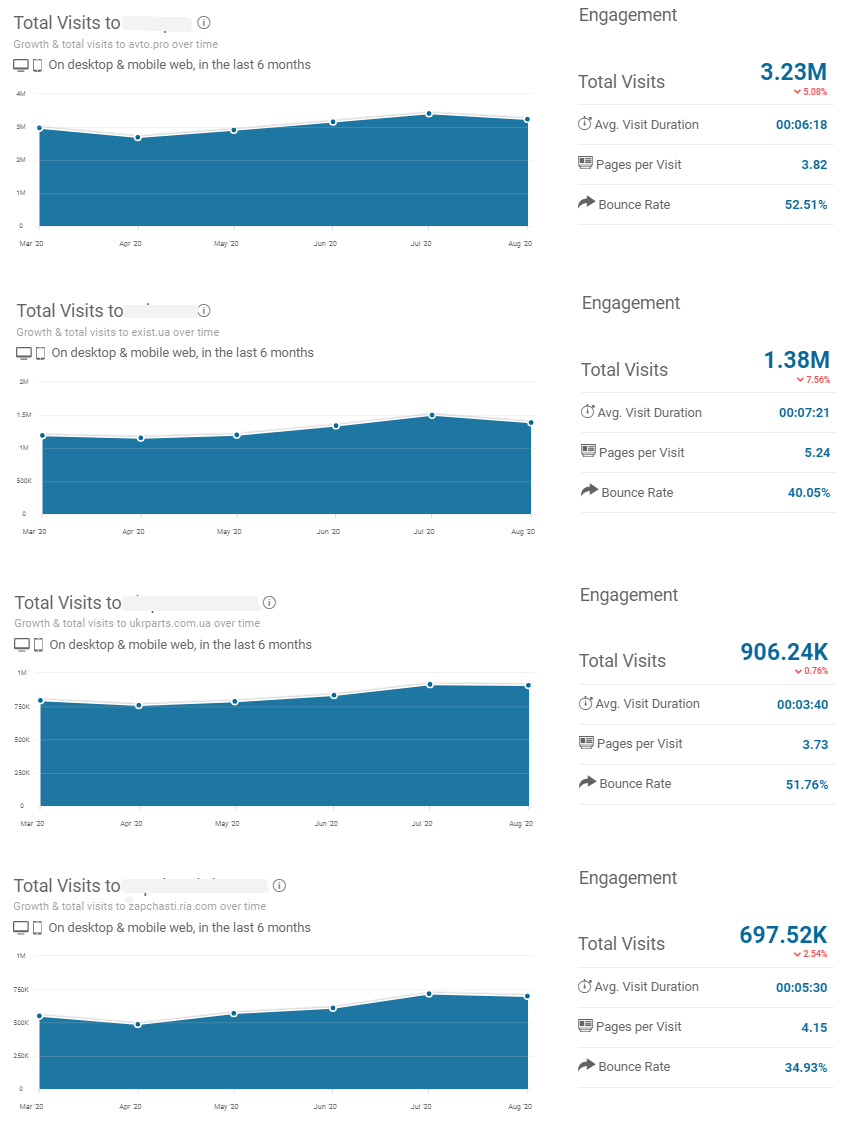
Источник данных: SimilarWeb
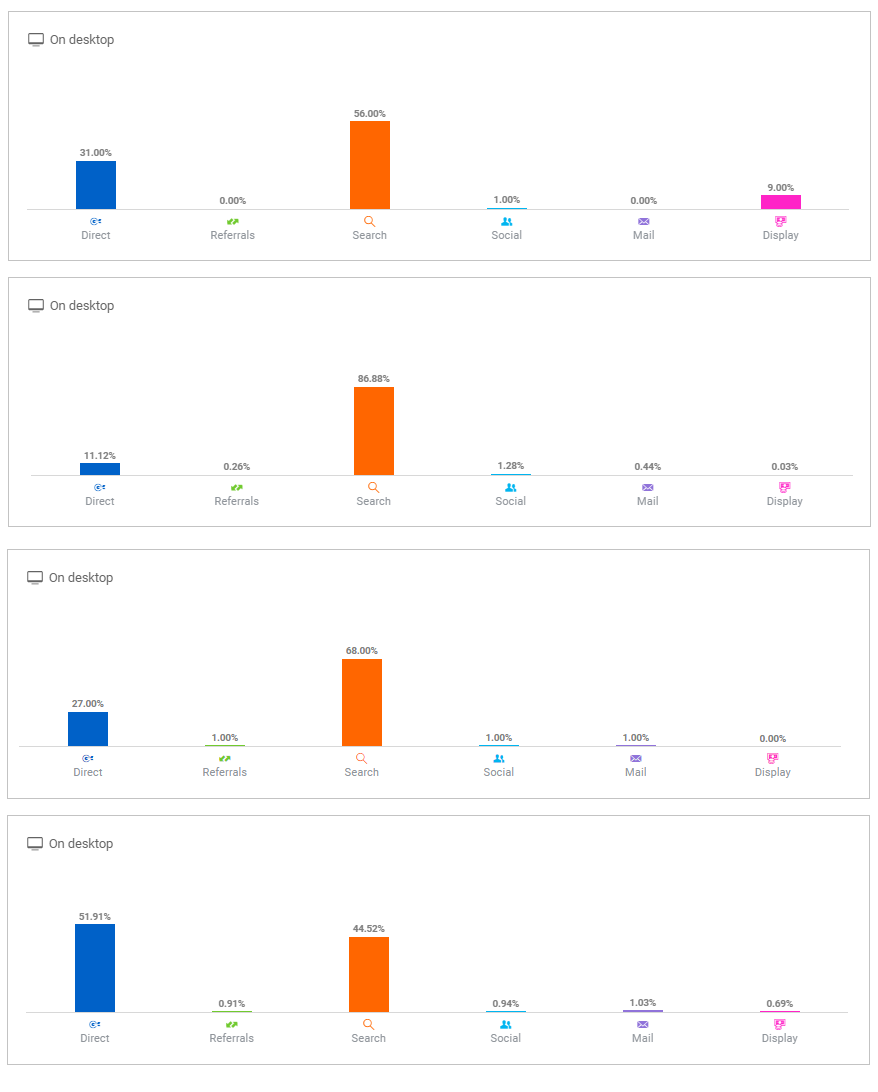
Источники трафика
Расположены по приоритетам в порядке убывания:
- Органический трафик из поисковых систем
-
Прямые заходы
-
Реклама
-
Трафик из социальных сетей
-
Переходы с других сайтов
-
E-mail
Объем рынка
Емкость рынка автозапчастей на конец 2019 год составила более $3 млрд. Из них $195 млн - это интернет-продажи ($800 тыс в день) и эта цифра стремительно растет. На 2020 год аналитики прогнозируют двукратный рост, а это уже почти полмиллиарда долларов!На сегодняшний день доля интернет-продаж составляют всего 6,5% от общего объема рынка. В будущем процент онлайн-покупок будет расти. Например в Европе на сегодня запчасти в интернете покупают до 20% людей, что почти в 3,5 раза больше чем в Украине.
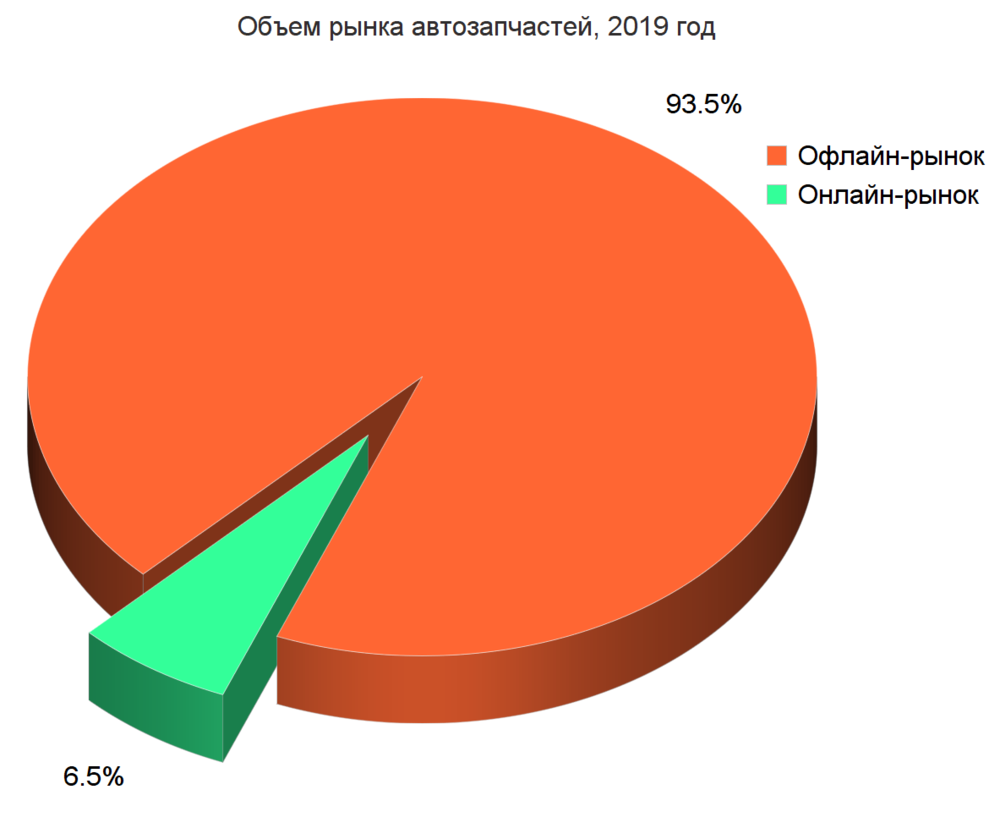
Data source: Allzap.ua
Structure and age of the fleet
According to AUTO-Consulting, about 10 million cars are registered in Ukraine, the active fleet is 6 million cars. In 2019, the figure increased by almost 400 thousand cars. Significantly increased the number of imported used cars from Europe and America. The average age of imported vehicles is 13 years. At the same time, the average age of the Ukrainian car fleet is 21.5 years.An increase in imports of older cars allows us to predict an increase in demand for auto parts. Today, the import structure looks like this:
- up to 2 years - 1%
- 3-5 years - 9%
- 6-8 years - 10%
- 9-15 years - 40%
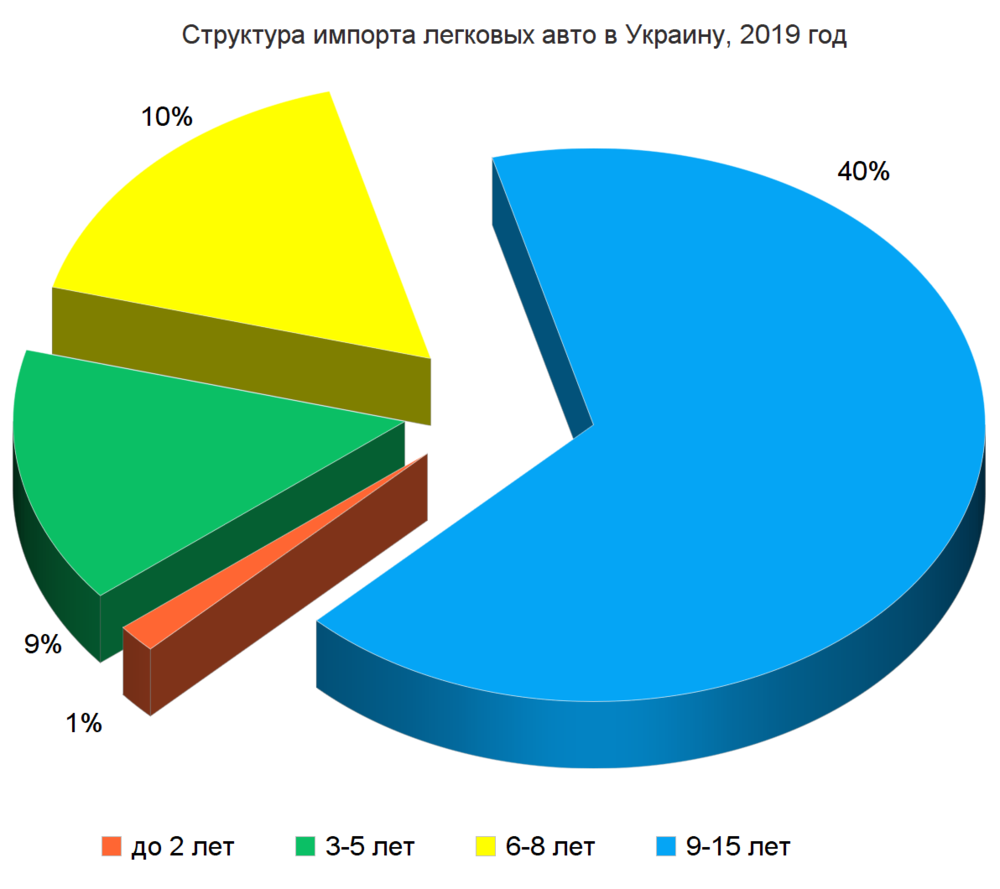
Data source: AUTO-Consulting
Technology
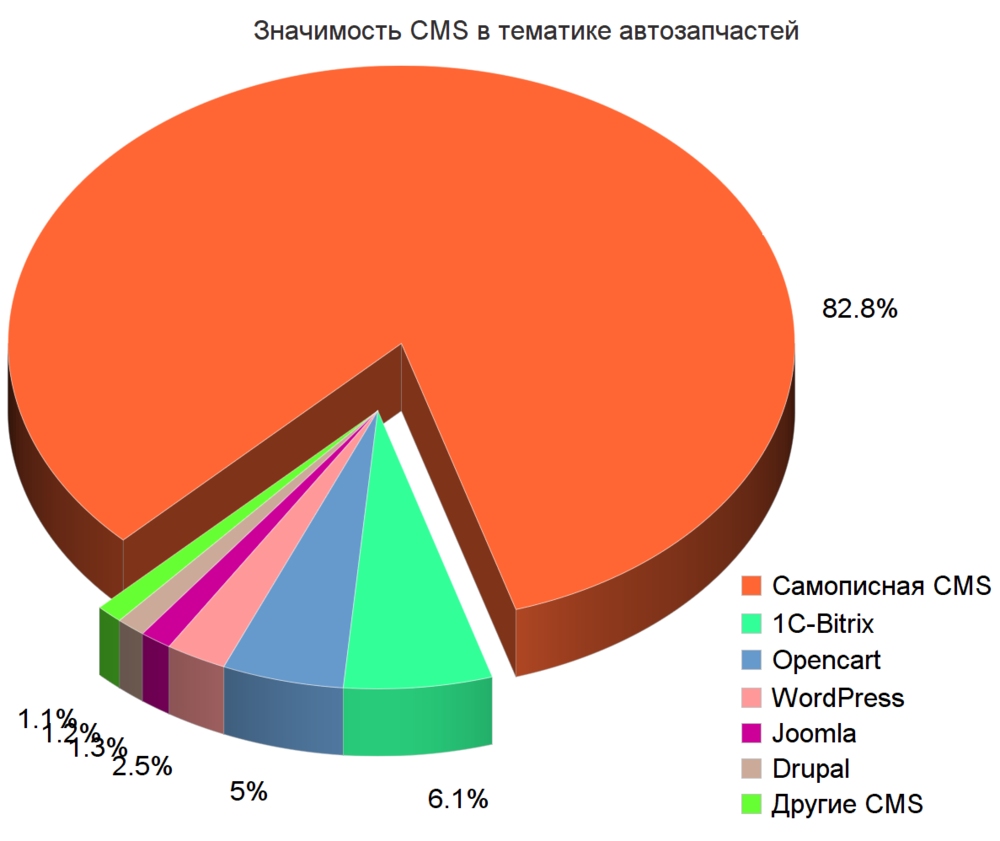
For the development of online auto parts stores, mostly self-written engines are used. This is explained by the fact that boxed solutions cannot provide productive work in the conditions of a multimillion-dollar nomenclature. In general, the distribution by topic looks like this:
- Homemade CMS 82.8%
- 1C-Bitrix 6.1%
- Opencart 5%
- WordPress 2.5%
- Joomla 1.3%
- Drupal 1.2%
- Other 1.1%
Data source: Google