
The auto parts market is assessed by experts as a highly competitive niche, – as a promising area for development. However, there have been many changes in the market over the past 5 years.
Will the crisis flatten sales curves?
The state of the car market
The automotive market is going through hard times. According to the State Statistics Committee of Ukraine, the growth rate of the car park began to slow down after 2013. In 2013, the number of cars sold increased for the last time, the figure was 12.8%, in 2014 – increased by only 3.1%, in 2015 – by 2.5%, in 2016 the situation did not change. The All-Ukrainian Association of Auto Importers and Dealers notes that the average age of cars in Ukraine exceeds European indicators and, according to various sources, ranges from 19 to 21.5 years.
Against this background, it is doubly curious to know what is happening with the auto parts market, given that older cars need repairs on average 2-3 times more often than brand new ones.
We have collected statistics on auto parts for the last 3-5 years. This information will allow you to assess the state of the market and choose the direction in which you should move.
From offline to online
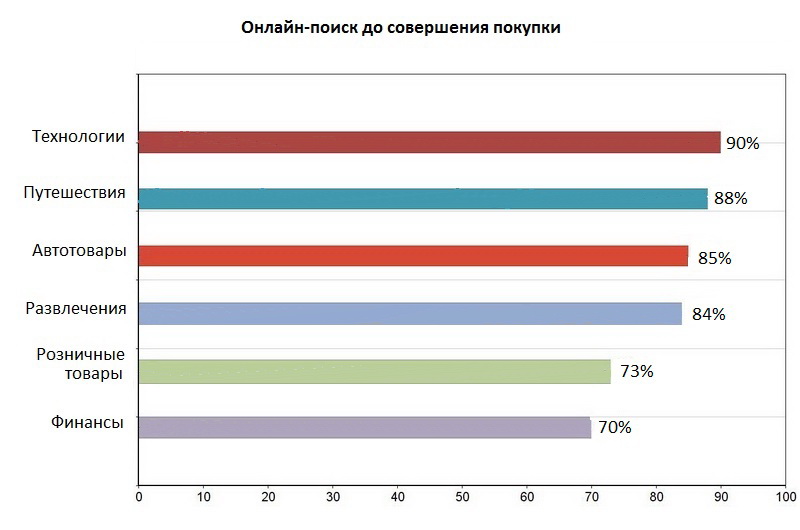
85% of consumers search online for parts before they buy. According to TNS' research commissioned by Google, published in AIN magazine, auto products ranked third in the list of products that users search online more often, than offline.
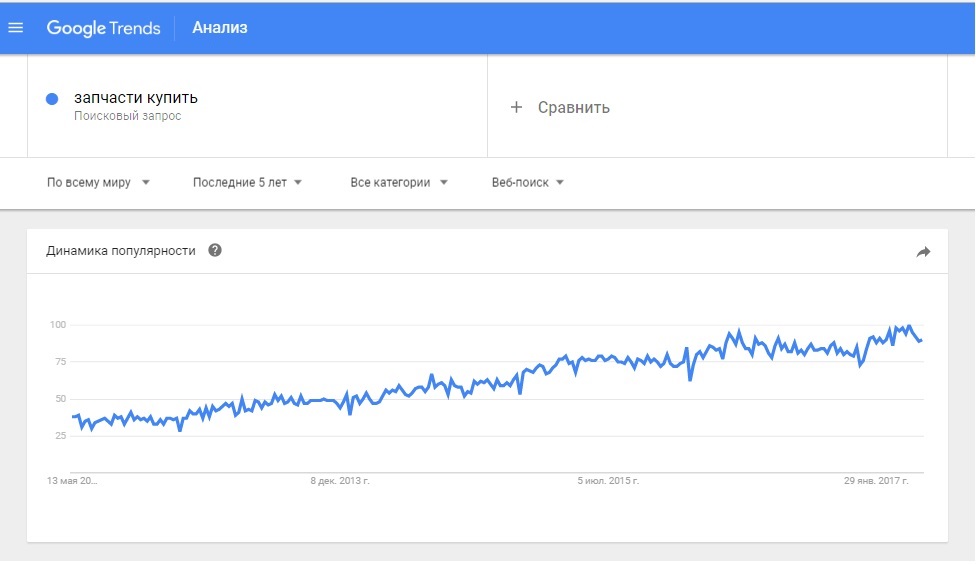
In the last 5 years, the interest of users of the Google search engine in buying spare parts online has grown 4 times. This is evidenced by Google Trends statistics for the query "buy spare parts".
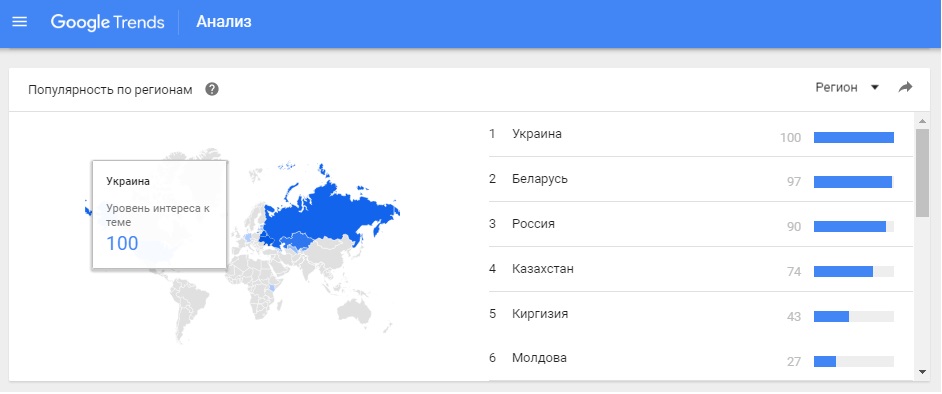
Numbers indicate the level of interest in a topic, based on the highest score in the table for a particular region and time period. 100 points mean the highest level of query popularity, 50 – the popularity level of the request is half as high as in the first case, 0 – the level of popularity of the request is not higher than 1% of the level in the first case.
Remarkably, Ukrainians show the greatest interest in buying spare parts online. The result is evaluated in points, similar to the first table.
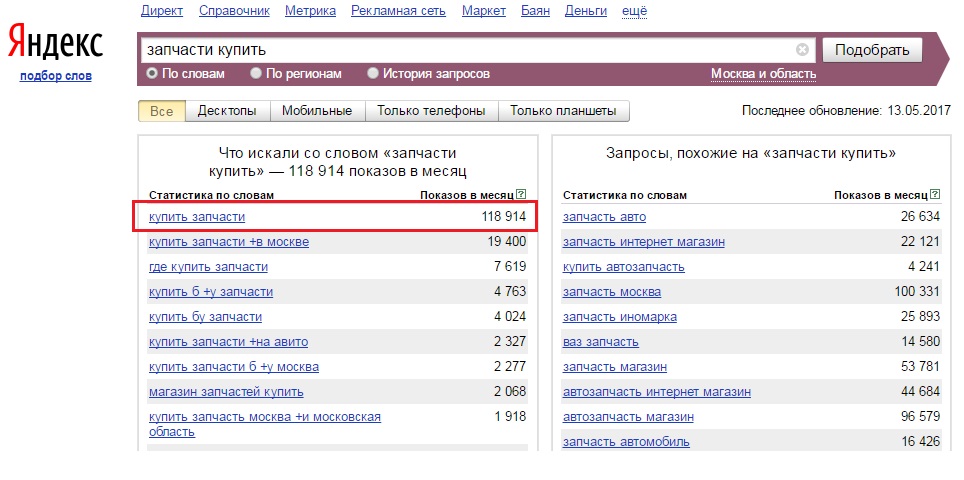
118914 monthly impressions are made by Yandex at the request "buy spare parts". But this is far from the limit: if we sum up the number of search phrases with which users turn to the search engine, we get a figure exceeding a billion requests.
The average cost of a click in Google AdWords increased by UAH 0.90. In 2013, the average cost of a click to the site for advertising was UAH 1.60, in 2016 it increased to UAH 2.50 p>
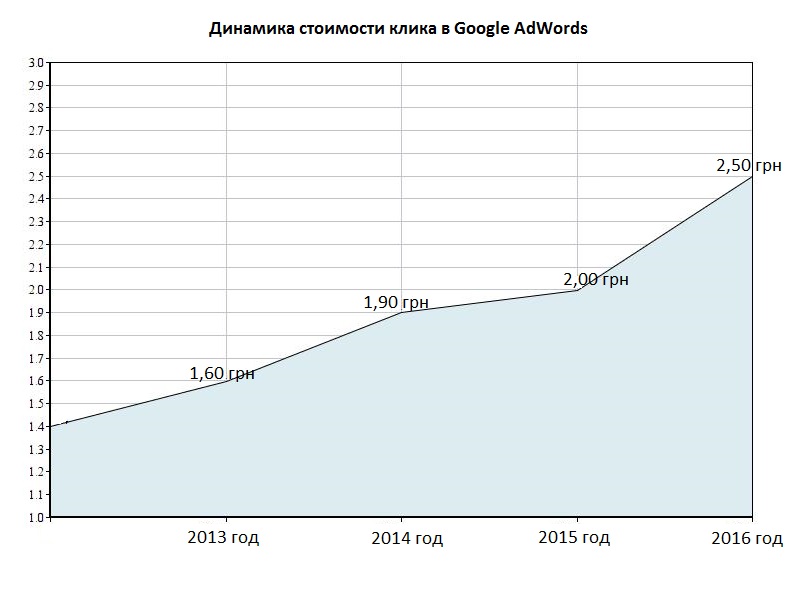
Recall that a distinctive feature of contextual advertising Google AdWords – pay per click, i.e. for the user's transition to your site. To date, the minimum cost per click – 0.30 UAH, maximum – UAH 25.0
Cost per click – the value is not constant. Many factors influence pricing: from the popularity of the request to the promotion region.
The increase in cost per click indicates an increase in demand for auto parts on the Internet.
Average check
The amount of the average check has more than doubled over the past three years in an online auto parts store. Today's average purchase amount is 1350.0 UAH, while in 2013 – only UAH 650.0
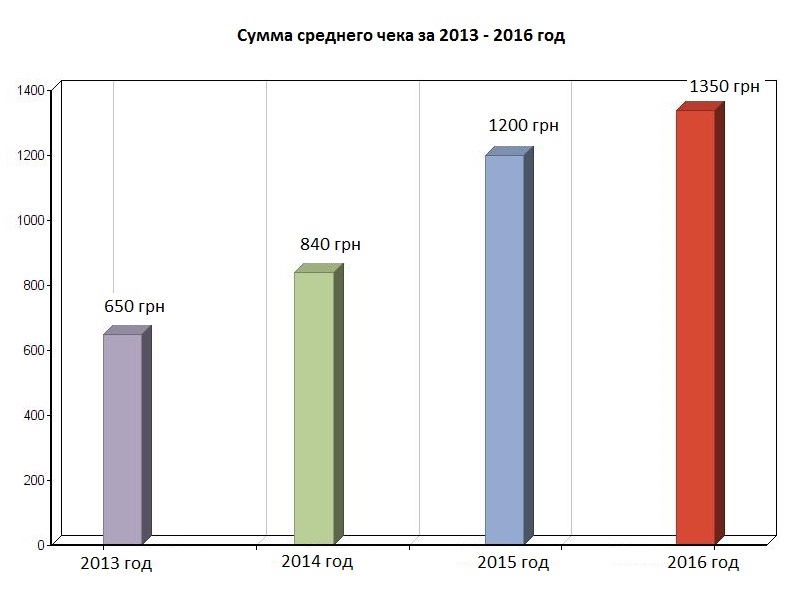
*Statistics is based on the analytical data of the portal allzap.ua
Number of orders per day
Doubled in the last 3 yearsThe average number of completed orders has increased in online auto parts stores.
The number of completed orders, as a rule, differs from the number of completed orders, therefore, the amount of orders that ended in payment was taken into account. Only a completed and paid order can be considered a real indicator.
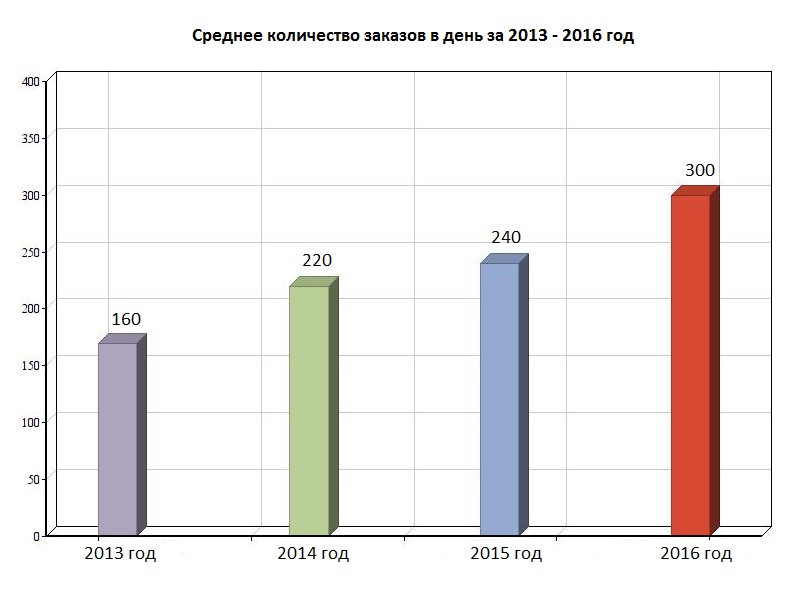
However, the number of successfully placed and completed orders directly depends on the website traffic.
|
Attendance per day |
Orders per day |
Attendance per month |
Orders per month |
|
10 000+ |
300+ |
300 000+ |
9000+ |
|
5000 – 7 000 |
175 |
150 000 – 210 000 |
5250 |
|
1000 – 5 000 |
90 |
30 000 – 150 000 |
2700 |
|
500 – 1000 |
22 |
15 000 – 30 |
660 |
|
up to 500 |
15 |
up to 15,000 |
450 |
Comprehensive promotion helps to increase traffic to the online store, and, accordingly, the number of orders placed.
From original to analogue
The disappointing dynamics of the economy could not but affect the auto parts market. But auto parts are not something you can refuse, given that more than half of the car fleet consists of older cars.
Trends of recent years – range review. Motorists do not repair cars less often, but prefer to save money, increasingly giving preference not to original spare parts, but to their analogues.
The table below provides information about the popular categories of auto parts in descending order, as well as popular manufacturing brands for each of them. The data was obtained on the basis of Yandex Wordstat statistics, which allows you to objectively assess the interest of users based on the number of requests to the search engine per month.
|
Parts category |
Number of requests per month |
TOP-3 brands in the category |
|
Brake discs |
157506 |
Brembo |
|
ATE |
||
|
Kashiyama |
||
|
Brake pads |
156698 |
Lukoil |
|
Liqui Moly |
||
|
Mobil Super |
||
|
Timing Belt |
81704 |
Contitech |
|
Dayco |
||
|
Gates |
||
|
Fuel filter |
76 585 |
MANN |
|
Knext Mahle |
||
|
Bosch |
||
|
Air filter |
75 830 |
MANN |
|
Hengst |
||
|
Bosch |
||
|
Oil filter |
73 756 |
Mann |
|
Bosch |
||
|
Yamaha |
||
|
Spark plugs |
58 491 |
Ngk |
|
Denso |
||
|
Bosch |
||
|
Shock Absorbers |
25196 |
KYB |
|
Monroe |
||
|
Sachs |
Fleet segmentation
Recent research by Research&Branding Group showed that 34% of Ukrainians drive Soviet/Russian cars, 27% of cars are over 15 years old.
65% of our compatriots preferred comfortable foreign cars. The Germans, French, Japanese and Koreans are in the lead.
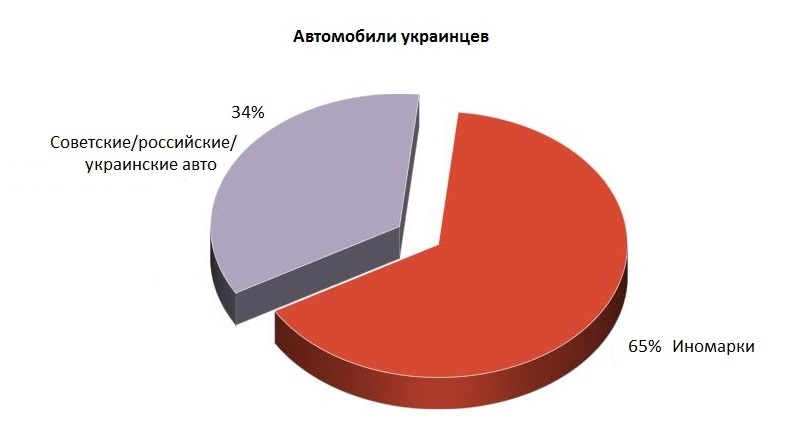
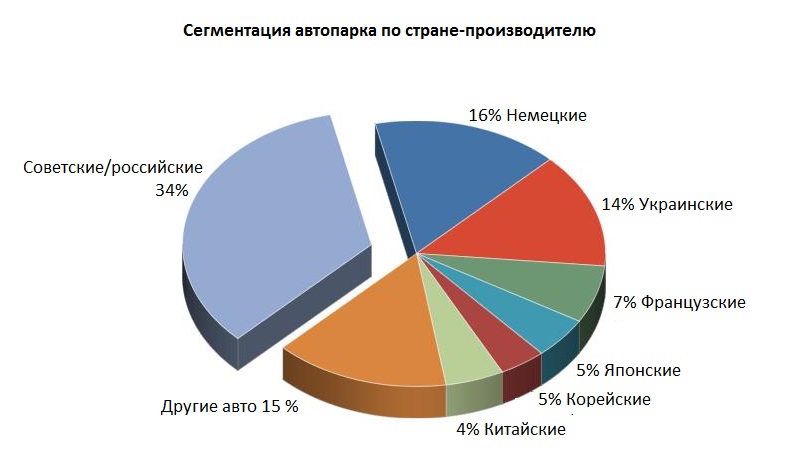
Depending on the country of production, the distribution of the share of cars in the car fleet looks like this:
- Soviet/Russian cars – 34%
- German – 16%
- Ukrainian – 14%
- French – 7%
- Japanese – 5%
- Korean – 5%
- Chinese – 4%
- Other foreign cars – 15%
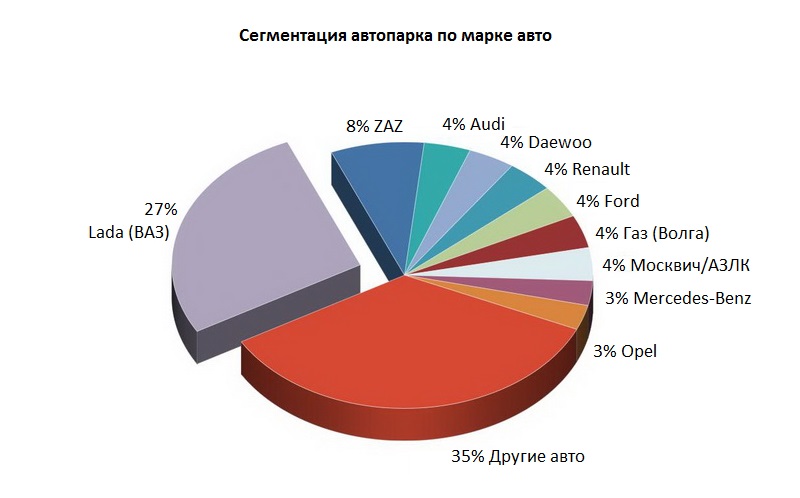
Depending on the brand, the sympathy of motorists was distributed as follows:
- Lada (VAZ) – 27%
- ZAZ – 8%
- Audi – 4%
- Daewoo – 4%
- Renault – 4%
- Ford – 4%
- Gas (Volga) - 4%
- Moskvich/AZLK – 4%
- Mercedes-Venz – 3%
- Opel - 3%
- Other cars – 35%
Given the age and variety of cars on Ukrainian roads, the formation of the assortment should be approached with special responsibility. And someone, perhaps, should think about changing priorities.
But do not flatter yourself and switch to the supply of spare parts for domestic cars. The most reasonable solution for those who plan to start a business on the Internet, – launch of a multi-brand auto parts store, because two-thirds of our compatriots prefer foreign cars. Owners of functioning online stores should think about the choice and subsequent promotion of landing pages, the content of which is most relevant to the interests of users.
Don't make mistakes, grow and develop with us!